 Add to Chrome
 Add to Firefox
 Add to Edge
Haotian Xia
SportQA: A Benchmark for Sports Understanding in Large Language Models
Feb 24, 2024
A deep understanding of sports, a field rich in strategic and dynamic content, is crucial for advancing Natural Language Processing (NLP). This holds particular significance in the context of evaluating and advancing Large Language Models (LLMs), given the existing gap in specialized benchmarks. To bridge this gap, we introduce SportQA, a novel benchmark specifically designed for evaluating LLMs in the context of sports understanding. SportQA encompasses over 70,000 multiple-choice questions across three distinct difficulty levels, each targeting different aspects of sports knowledge from basic historical facts to intricate, scenario-based reasoning tasks. We conducted a thorough evaluation of prevalent LLMs, mainly utilizing few-shot learning paradigms supplemented by chain-of-thought (CoT) prompting. Our results reveal that while LLMs exhibit competent performance in basic sports knowledge, they struggle with more complex, scenario-based sports reasoning, lagging behind human expertise. The introduction of SportQA marks a significant step forward in NLP, offering a tool for assessing and enhancing sports understanding in LLMs.
Advanced Volleyball Stats for All Levels: Automatic Setting Tactic Detection and Classification with a Single Camera
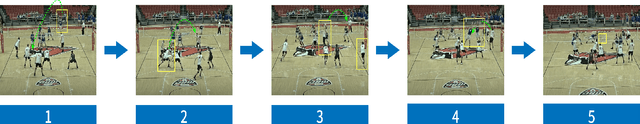
Sep 26, 2023This paper presents PathFinder and PathFinderPlus, two novel end-to-end computer vision frameworks designed specifically for advanced setting strategy classification in volleyball matches from a single camera view. Our frameworks combine setting ball trajectory recognition with a novel set trajectory classifier to generate comprehensive and advanced statistical data. This approach offers a fresh perspective for in-game analysis and surpasses the current level of granularity in volleyball statistics. In comparison to existing methods used in our baseline PathFinder framework, our proposed ball trajectory detection methodology in PathFinderPlus exhibits superior performance for classifying setting tactics under various game conditions. This robustness is particularly advantageous in handling complex game situations and accommodating different camera angles. Additionally, our study introduces an innovative algorithm for automatic identification of the opposing team's right-side (opposite) hitter's current row (front or back) during gameplay, providing critical insights for tactical analysis. The successful demonstration of our single-camera system's feasibility and benefits makes high-level technical analysis accessible to volleyball enthusiasts of all skill levels and resource availability. Furthermore, the computational efficiency of our system allows for real-time deployment, enabling in-game strategy analysis and on-the-spot gameplan adjustments.
Graph Encoding and Neural Network Approaches for Volleyball Analytics: From Game Outcome to Individual Play Predictions
Aug 22, 2023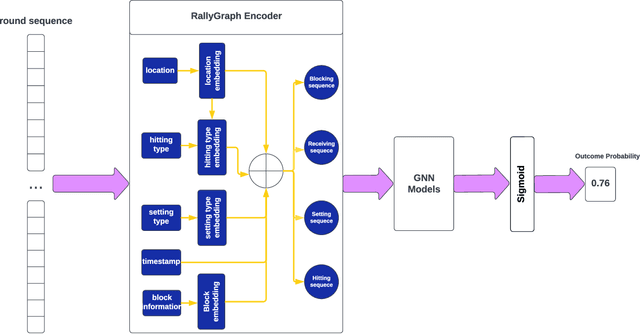
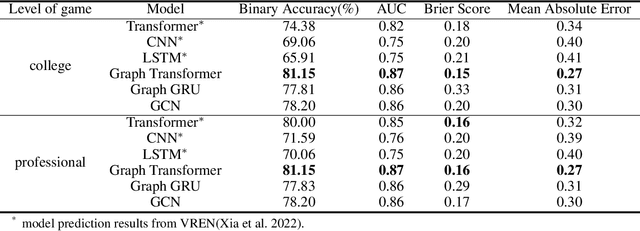
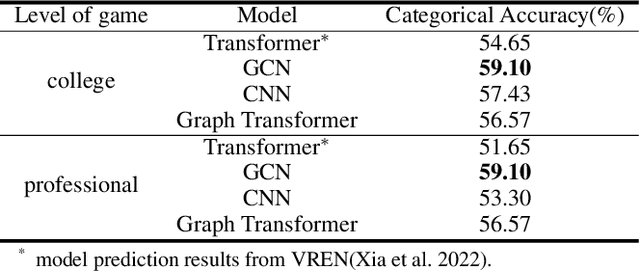
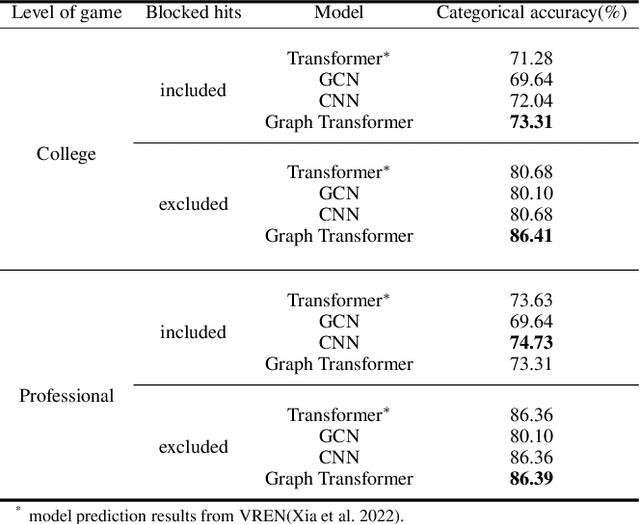
This research aims to improve the accuracy of complex volleyball predictions and provide more meaningful insights to coaches and players. We introduce a specialized graph encoding technique to add additional contact-by-contact volleyball context to an already available volleyball dataset without any additional data gathering. We demonstrate the potential benefits of using graph neural networks (GNNs) on this enriched dataset for three different volleyball prediction tasks: rally outcome prediction, set location prediction, and hit type prediction. We compare the performance of our graph-based models to baseline models and analyze the results to better understand the underlying relationships in a volleyball rally. Our results show that the use of GNNs with our graph encoding yields a much more advanced analysis of the data, which noticeably improves prediction results overall. We also show that these baseline tasks can be significantly improved with simple adjustments, such as removing blocked hits. Lastly, we demonstrate the importance of choosing a model architecture that will better extract the important information for a certain task. Overall, our study showcases the potential strengths and weaknesses of using graph encodings in sports data analytics and hopefully will inspire future improvements in machine learning strategies across sports and applications by using graphbased encodings.
VREN: Volleyball Rally Dataset with Expression Notation Language
Sep 28, 2022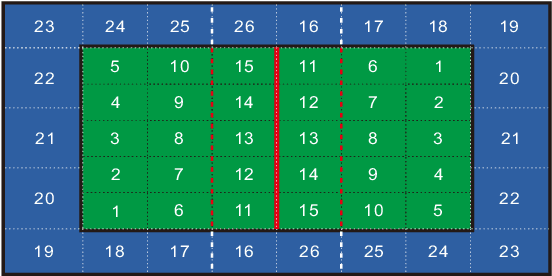
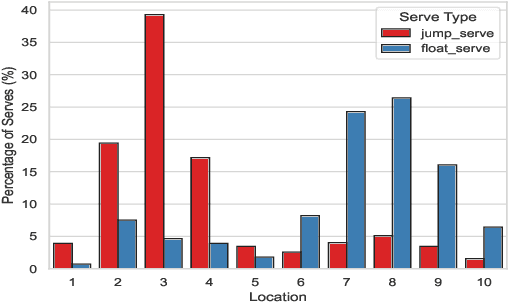
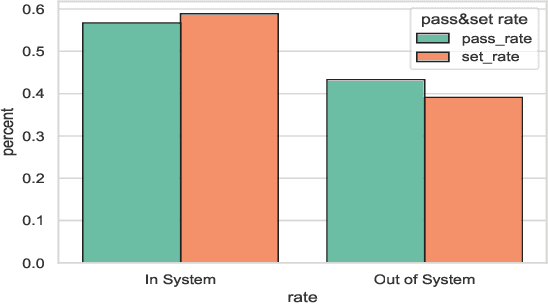
This research is intended to accomplish two goals: The first goal is to curate a large and information rich dataset that contains crucial and succinct summaries on the players' actions and positions and the back-and-forth travel patterns of the volleyball in professional and NCAA Div-I indoor volleyball games. While several prior studies have aimed to create similar datasets for other sports (e.g. badminton and soccer), creating such a dataset for indoor volleyball is not yet realized. The second goal is to introduce a volleyball descriptive language to fully describe the rally processes in the games and apply the language to our dataset. Based on the curated dataset and our descriptive sports language, we introduce three tasks for automated volleyball action and tactic analysis using our dataset: (1) Volleyball Rally Prediction, aimed at predicting the outcome of a rally and helping players and coaches improve decision-making in practice, (2) Setting Type and Hitting Type Prediction, to help coaches and players prepare more effectively for the game, and (3) Volleyball Tactics and Attacking Zone Statistics, to provide advanced volleyball statistics and help coaches understand the game and opponent's tactics better. We conducted case studies to show how experimental results can provide insights to the volleyball analysis community. Furthermore, experimental evaluation based on real-world data establishes a baseline for future studies and applications of our dataset and language. This study bridges the gap between the indoor volleyball field and computer science.
Empirical Quantitative Analysis of COVID-19 Forecasting Models
Oct 01, 2021


COVID-19 has been a public health emergency of international concern since early 2020. Reliable forecasting is critical to diminish the impact of this disease. To date, a large number of different forecasting models have been proposed, mainly including statistical models, compartmental models, and deep learning models. However, due to various uncertain factors across different regions such as economics and government policy, no forecasting model appears to be the best for all scenarios. In this paper, we perform quantitative analysis of COVID-19 forecasting of confirmed cases and deaths across different regions in the United States with different forecasting horizons, and evaluate the relative impacts of the following three dimensions on the predictive performance (improvement and variation) through different evaluation metrics: model selection, hyperparameter tuning, and the length of time series required for training. We find that if a dimension brings about higher performance gains, if not well-tuned, it may also lead to harsher performance penalties. Furthermore, model selection is the dominant factor in determining the predictive performance. It is responsible for both the largest improvement and the largest variation in performance in all prediction tasks across different regions. While practitioners may perform more complicated time series analysis in practice, they should be able to achieve reasonable results if they have adequate insight into key decisions like model selection.